Insights On Today’s
Challenges to Homeownership
Challenges to Homeownership
Although home price appreciation has gradually slowed from 2017’s levels, that doesn’t mean that the national housing shortage has been solved. If anything, at least according to National Association of Realtors® (NAR) Chief Economist Lawrence Yun, housing production remains severely constrained. During his recent economic outlook and forecast presentation at the association’s annual Conference & Expo in Boston, Yun concluded that the U.S. continues to suffer from a housing shortage because production is simply not keeping up with population and job growth.
In an effort to address this chronic issue at the local level, the NAR has even launched a website for information on how interested parties can effectively advocate for more housing supply in their communities. According to NAR statistics on the site, while national home homes prices have risen by 48 percent over the last six years, housing inventory has declined by 28 percent, or reaching its lowest level since 1999.
In addition, NAR researchers found that whereas the historical rule of thumb had been one new single-family permit for each new job to keep up with demand, over the last five years that ratio has been cut in half, which means that single-family production has been running at just 50 percent of capacity. Similarly, as of the third quarter of 2018, researchers producing the National Association of Home Builders’ (NAHB) Leading Markets Index concluded that single-family permit activity, adjusted for population growth, was operating at 59 percent of what was historically required in times of economic growth.
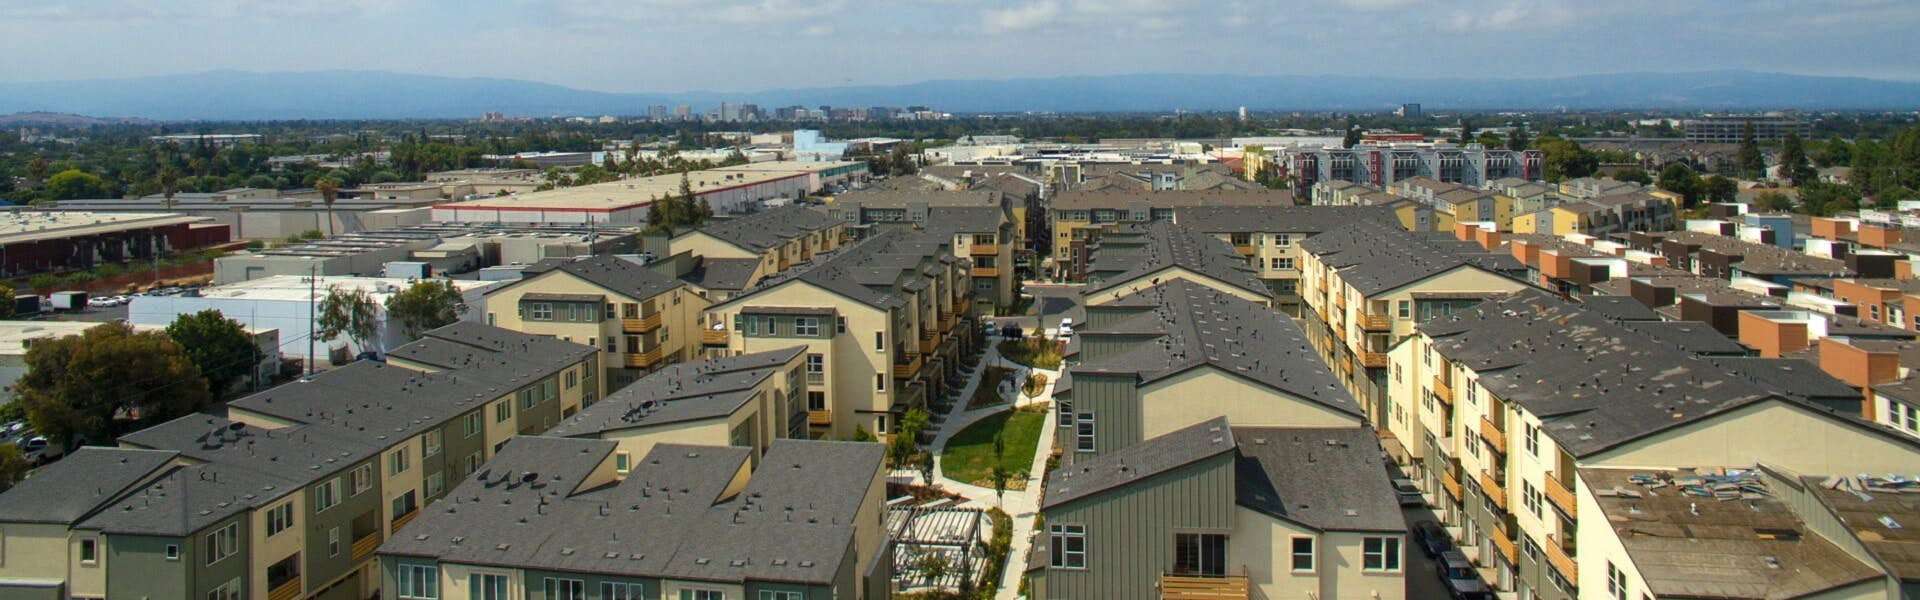
In fact, this ongoing production challenge is even more pronounced in the San Francisco Bay Area. According to data from the U.S. Census Bureau for the nine Bay Area counties as summarized in the table below, between the years 2010 to 2017, the total housing deficit had risen by another 137,500 units. These deficits ranged from under 750 homes in the North Bay’s Napa County to over 41,000 in the East Bay’s fast-growing Alameda County.

The “Housing Required to Keep Pace with Change in Population” formula in the table is based on adding housing stock at a rate of 43 percent of the population, and equates approximately to an existing average household size of 2.3 persons. Although 253,317 new homes were required to be built over this seven-year period in the nine counties to keep up with population growth, just 45 percent was actually added to the housing stock.
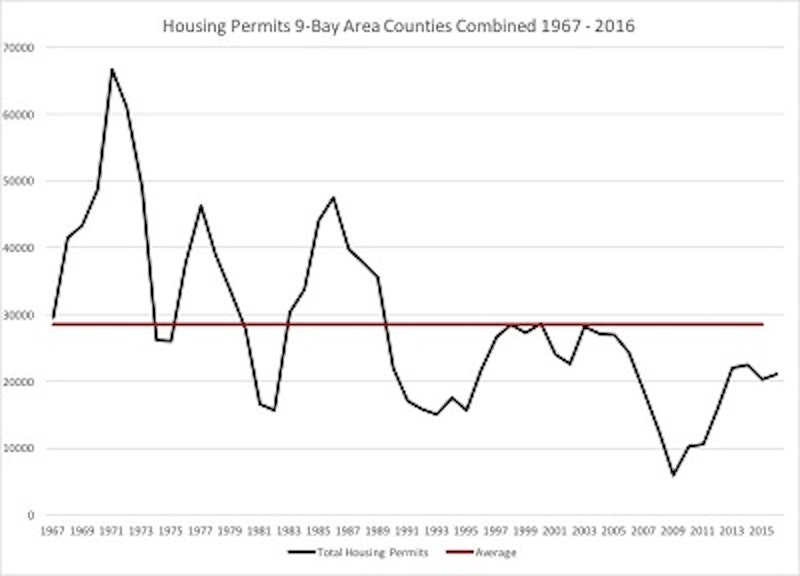
A different analysis reviews building permits issued between 1967 and 2016, represented on the adjacent chart. During this time period, there was an average of 28,500 housing permits issued for all nine Bay Area counties combined (adjacent chart). Between just 2009 and 2016, however, there was an average of just 16,000 permits per year, as the building industry struggled to emerge from the deepest recession since the Great Depression.
Although there was a rise in 2016 to 21,000 permits, housing production still remained 27 percent below the longer-term average. Additionally, an important caveat to this analysis is that population growth during this period would require even more building permits than the historical average to keep up with demand.
Given the ongoing challenges of building more housing in the Bay Area, TTLC remains committed to help address this need with a core focus on entry-level and moderately priced homes with our builder partners. Since much of the Bay Area is already built out, we also believe that much of the housing deficit can be met by creatively repurposing under-utilized or obsolete properties to new residential uses.