Insights On Today’s
Challenges to Homeownership
Challenges to Homeownership
Housing inventory in many markets around the country is in short supply, and the resulting squeeze on home availability has pushed prices out of reach for many. Even those earning strong incomes, which just a few years ago would qualify for a home purchase, are struggling to qualify for a home today. One of the trends contributing to this situation can be found in labor force growth in metro centers.
According to data compiled by the USDA Department of Research and obtained from the Bureau of Economic Analysis, between 2001 and 2015 the US economy has become more centered toward jobs in services, trade and transportation, technology, and government. Many of these jobs tend to be located in metro areas, and this growing labor force is fueling the demand for housing. With housing availability constrained, prices spiral upward.
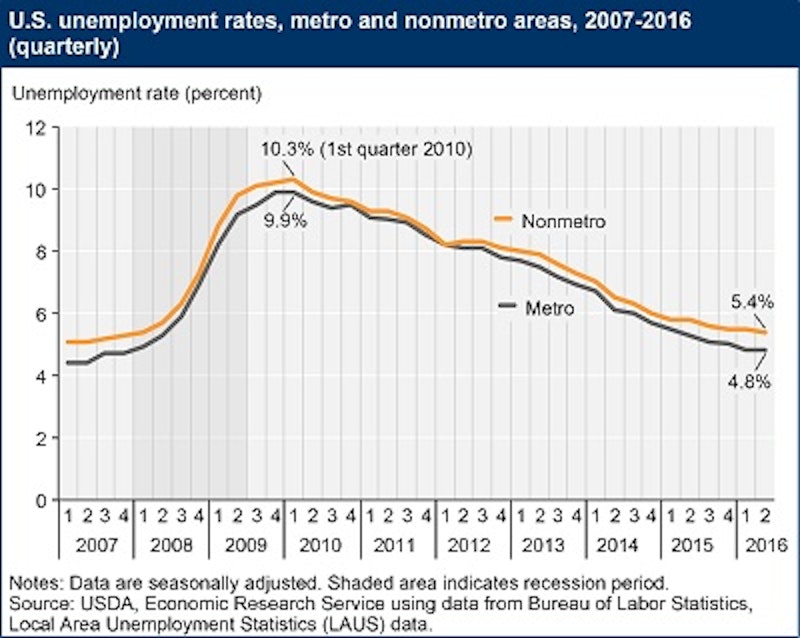
Comparing unemployment rates between metro and non-metro regions reveals that, since the recovery began in 2012, unemployment has dropped in both areas to a level consistent with historical patterns. Metro regions have fared somewhat better, with an unemployment rate reported at 4.8% in 2016, roughly 0.6% lower than in non-metro areas reported at 5.4%. This trend reflects the pattern in unemployment rates at the market’s pre-recession high, as well as during the depths of the recession.
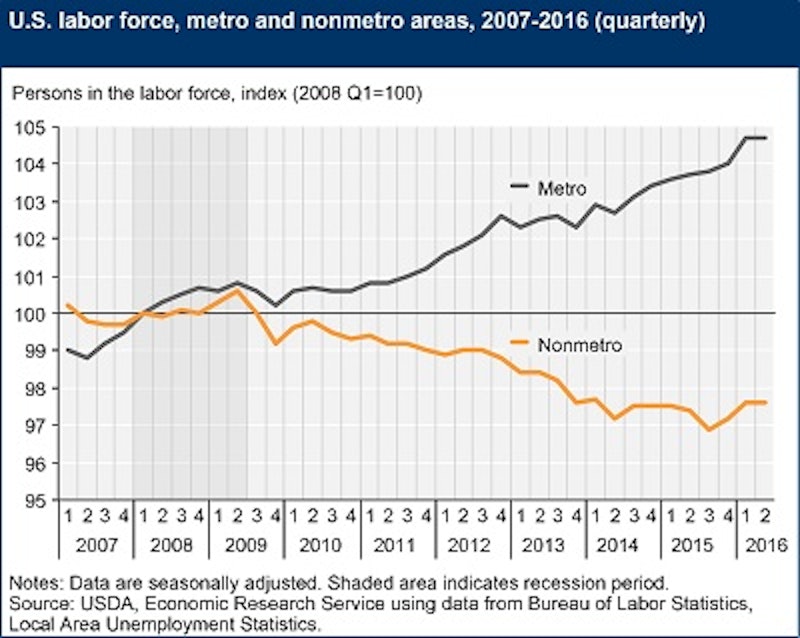
However, when we look deeper at the labor force trend, we find growth in metro regions is significantly higher than in non-metro areas. Even though unemployment patterns are in line historically, in non-metro locations the labor force has shrunk, while the labor force has increased considerably in metro areas. This may indicate that more people are moving to metro regions where the jobs are.
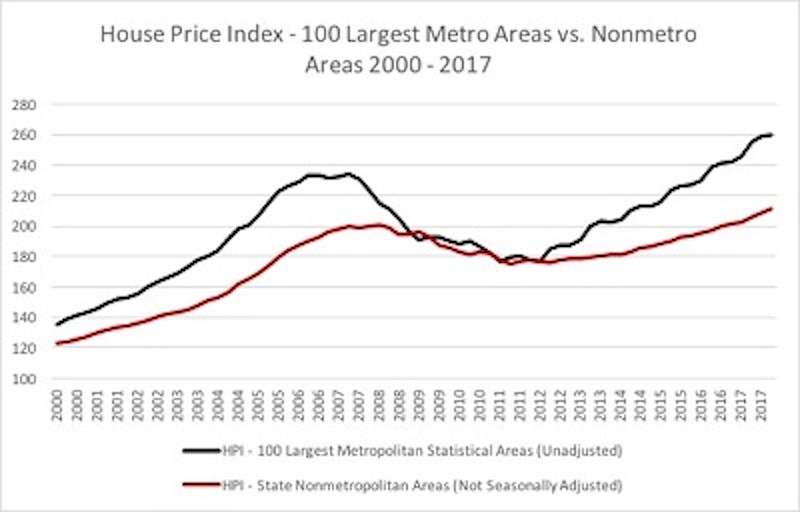
Based on our analysis of data from the Federal Housing Agency, we see the effect of labor force changes in the difference in home price appreciation between the 100 largest metro areas and non-metro areas. Between the years 2000 and 2017, the 100 largest metropolitan housing markets experienced a greater rate of appreciation over non-metro, nearly 50% higher according to data from the Housing Price Index.
This is just one of several factors contributing to the rate of increase in home prices, but it’s an important one. It’s clear we need to address the imbalance that is impacting housing supply in our cities. Municipalities must find new avenues to improve options for housing.
TTLC is poised to help address this critical need through our focus on creating moderately priced sustainable housing opportunities for the next generation of homebuyers. We are seeking to help balance supply by repurposing under-utilized property to a new residential use.