Insights On Today’s
Challenges to Homeownership
Challenges to Homeownership
Following several years of above-average growth in home prices which softened during the last half of 2018, it’s understandable that potential homebuyers would be concerned about another housing slowdown. But this isn’t 2008. This is more a repeat of 1994, when a combination of rising interest rates and listings hitting their price ceilings led to a temporary lull in the market. The market then rebalanced between buyers and sellers.
While prices may be adjusting in the short term, the long-term fundamentals remain solid. A key indicator of this, can be found in the most recent survey from the Mortgage Bankers Association. The recent dip in mortgage rates is making more homes affordable. This has helped to boost purchase loan volume up by 17 percent from the previous week and four percent year-on-year.
Still, activity at the local level can vary widely. Since the last pricing peak of June 2018 through November, the decline in list prices has ranged from less than 1.50 percent nationally to about 9.00 percent in high-priced San Jose. Yet year-on-year, listing prices remained higher for all of the areas in which TTLC does business.
Even with less pressure from higher mortgage rates, the housing shortage will remain with us due to a chronic demand-supply imbalance. As noted in our previous month’s Market Perspective, a recent analysis by Freddie Mac found an existing pent-up supply of over 2.5 million homes. This chronic lack of inventory will continue to provide a floor under prices until that shortfall is met.
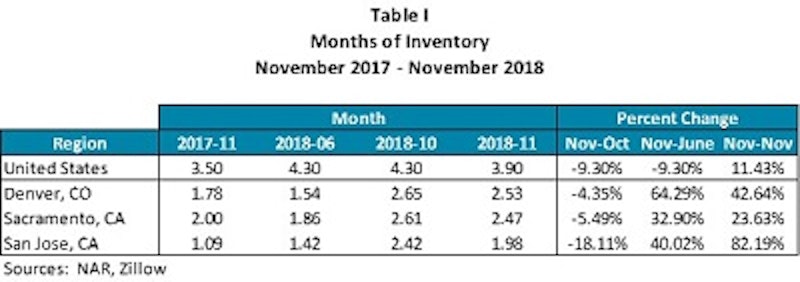
Though there was a significant rise in interest rates for most of 2018, the number of months to sell existing inventory remained far below the six-month timeline historically considered to be balanced between buyers and sellers (Table I). While timelines certainly did rise year-on-year through November 2018, in general, the markets in the areas studied continue to favor sellers due to low inventory.
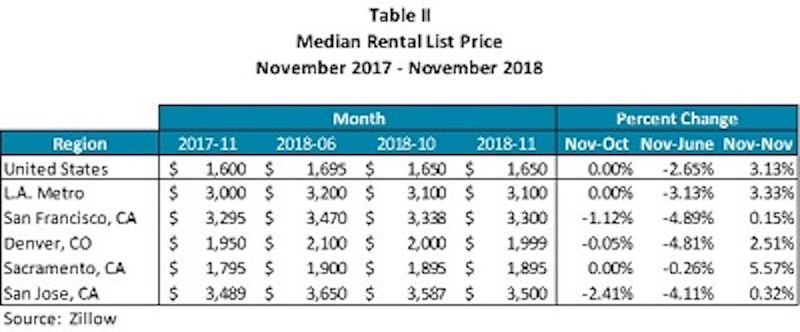
Interestingly, a similar pricing trend was also underway for rental properties during the annual period of November 2017-November 2018 (Table II). In this case, median list prices peaked in June 2018 before dipping back again as that market also found its own pricing balance. Nonetheless, year-on-year through November 2018, rents were either close to being flat in higher-priced markets such as San Francisco and San Jose, or saw annual increases of about 2.50 to 5.50 percent. In addition, rents are widely expected to rebound if more potential home buyers sit on the sidelines and put more pressure on existing rental stock. If mortgage rates continue to stabilize and make home buying more affordable, then it could very well be higher rents prompting would-be buyers back into the market.
2019 is not 2008 for a number of reasons, including lack of over-building, stricter underwriting standards, reasonable mortgage debt relative to incomes, and wage growth which is now starting to surpass 3.0 percent per year. The price adjustments we have seen in the last months of 2018 appear to be more a reaction to higher interest rates and sellers testing the market. Peering into 2019 and beyond, we believe the trend will be a combination of flatter price growth and more stable mortgage rates that should bolster both affordability and buyer confidence.
TTLC remains committed to helping address this ongoing housing inventory shortage by creating a variety of housing opportunities with our builder partners, with a primary focus on entry-level and moderately priced homes. In urban areas we seek to boost housing inventory by repurposing under-utilized or obsolete properties to new residential uses.